
Before
UTRADEA / 2022
From profile-first to performance-first
Turning behavioural data into a clearer portfolio experience
00 / Overview
The portfolio story was hiding below the profile.
I used behavioural analytics to turn scattered user sessions into a clearer product direction for Utradea’s portfolio experience.
By looking at where users scanned, clicked, paused, and dropped off, I uncovered a core mismatch: the page was structured like a profile, while users were trying to evaluate portfolio performance and find their next action.
01 / The challenge
The page had the data. The problem was the hierarchy.
Utradea’s portfolio page included profile identity, authority score, return metrics, watchlists, ideas, holdings, change logs, and performance data.
But behavioural data showed that users were not always reaching the information that mattered most. The page prioritized profile context, while users appeared to be looking for performance signals, portfolio status, and a clear next action.
Key research questions
- 01
Where do users look first when they land on the portfolio page?
- 02
What helps users understand portfolio performance fastest?
- 03
Which actions are not visible or clear enough?
- 04
What content is being pushed too low in the page?
02 / Recommended direction
Make the first viewport do more work.
The portfolio page needed to shift from a profile-led layout to a performance-led structure. Instead of giving early space to identity and banner visuals, the first viewport should help users understand portfolio status and decide what to do next.
Design direction
Reorganize the first screen around performance, key actions, and portfolio status so users can evaluate faster and act with more confidence.
What to prioritize
- 01Portfolio performance summary
- 02Primary actions
- 03Holdings, watchlist, and ideas
- 04Change log and supporting activity
- 05Compact profile identity
Product direction
Shifting the hierarchy
Shift the portfolio page from profile context to performance context in the first viewport.
- Move portfolio status higher
- Surface return metrics, portfolio health, and summary signals earlier.
- Bring key actions forward
- Make create, login, and write-idea actions easier to find.
- Reduce profile dominance
- Keep identity and banner visuals supportive, not leading.
- Create a clearer scan path
- Let users read orientation, performance, then action in that order.
After
Portfolio status, performance signals, and key actions lead the page.
03 / Research approach
Reading behaviour, not assumptions.
I combined Google Analytics and LogRocket to connect broad usage patterns with page-level behaviour.
Google Analytics
Device patterns, session depth, and broader usage behaviour.
LogRocket heatmaps
Click concentration, hover patterns, and areas of attention.
Session recordings
Hesitation, repeated actions, missed cues, and moments of friction.

- Usage context
- Behaviour signals
- Pattern synthesis
- Product direction
04 / Key findings
Five signals pointed to one hierarchy mismatch.
Behavioural findings / 05
Read each signal in context.
01 / 05
-
Key finding #1
Performance summary was the real entry point
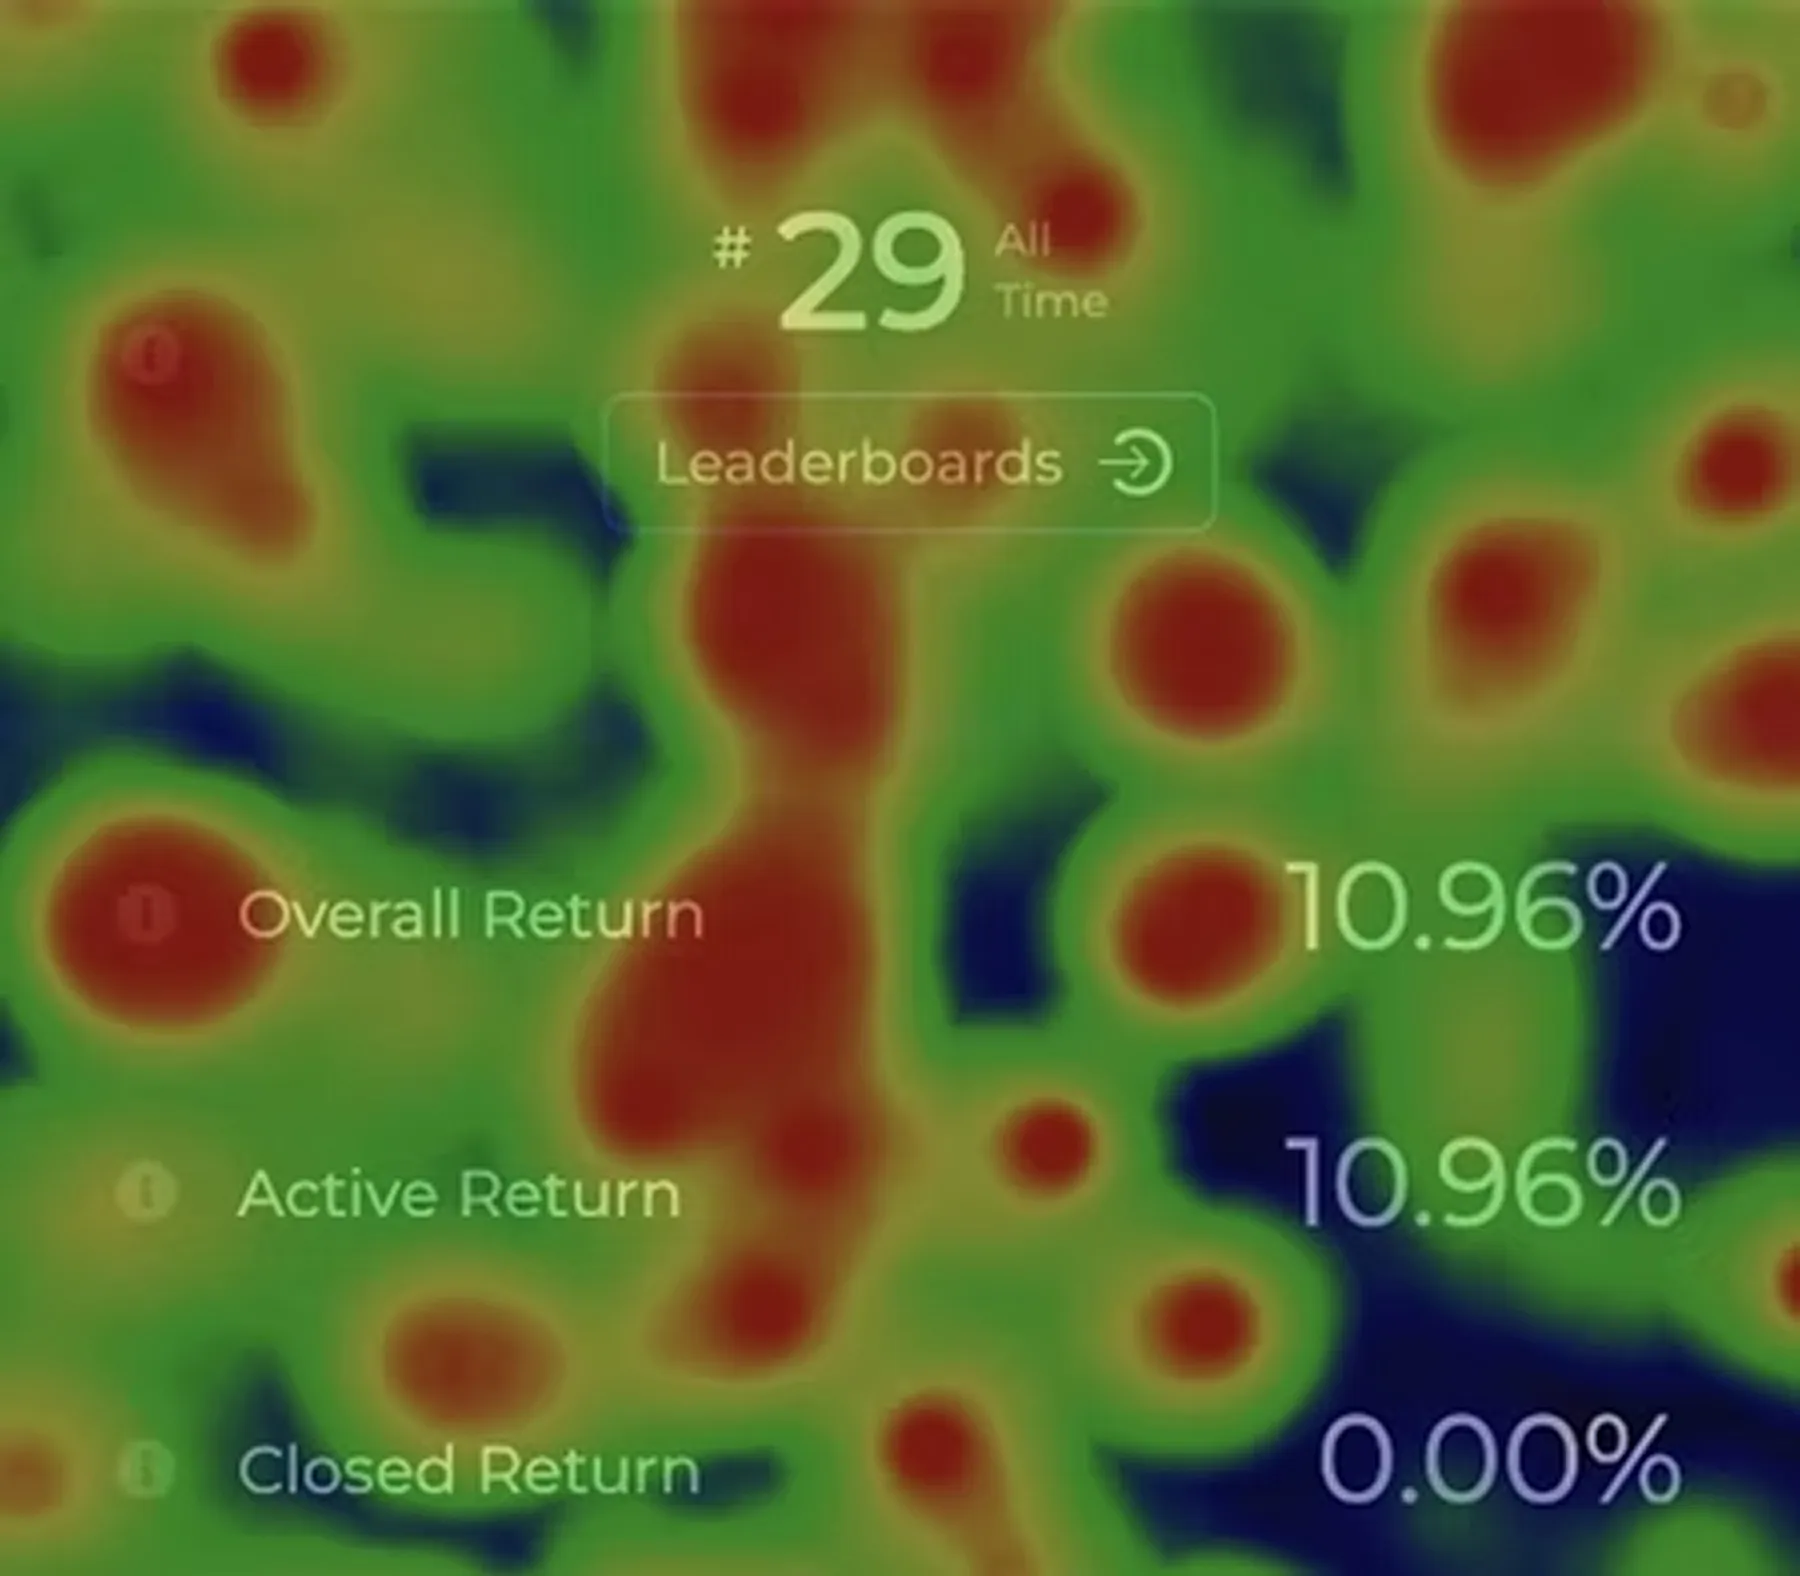
Users showed strong attention around overall return, ranking, and summary-style information. The overall return area received more attention than the active or closed return details.
The page did not need more data. It needed a clearer opening read.
- Signal
- Summary metrics received concentrated attention.
- Interpretation
- Users wanted the portfolio story first, before moving into detailed states.
- Recommendation
- Bring a stronger portfolio summary card closer to the top of the page, including overall return, active return, closed return, holdings summary, and watchlist/ideas status.
-
Key finding #2
The layout prioritized identity over performance
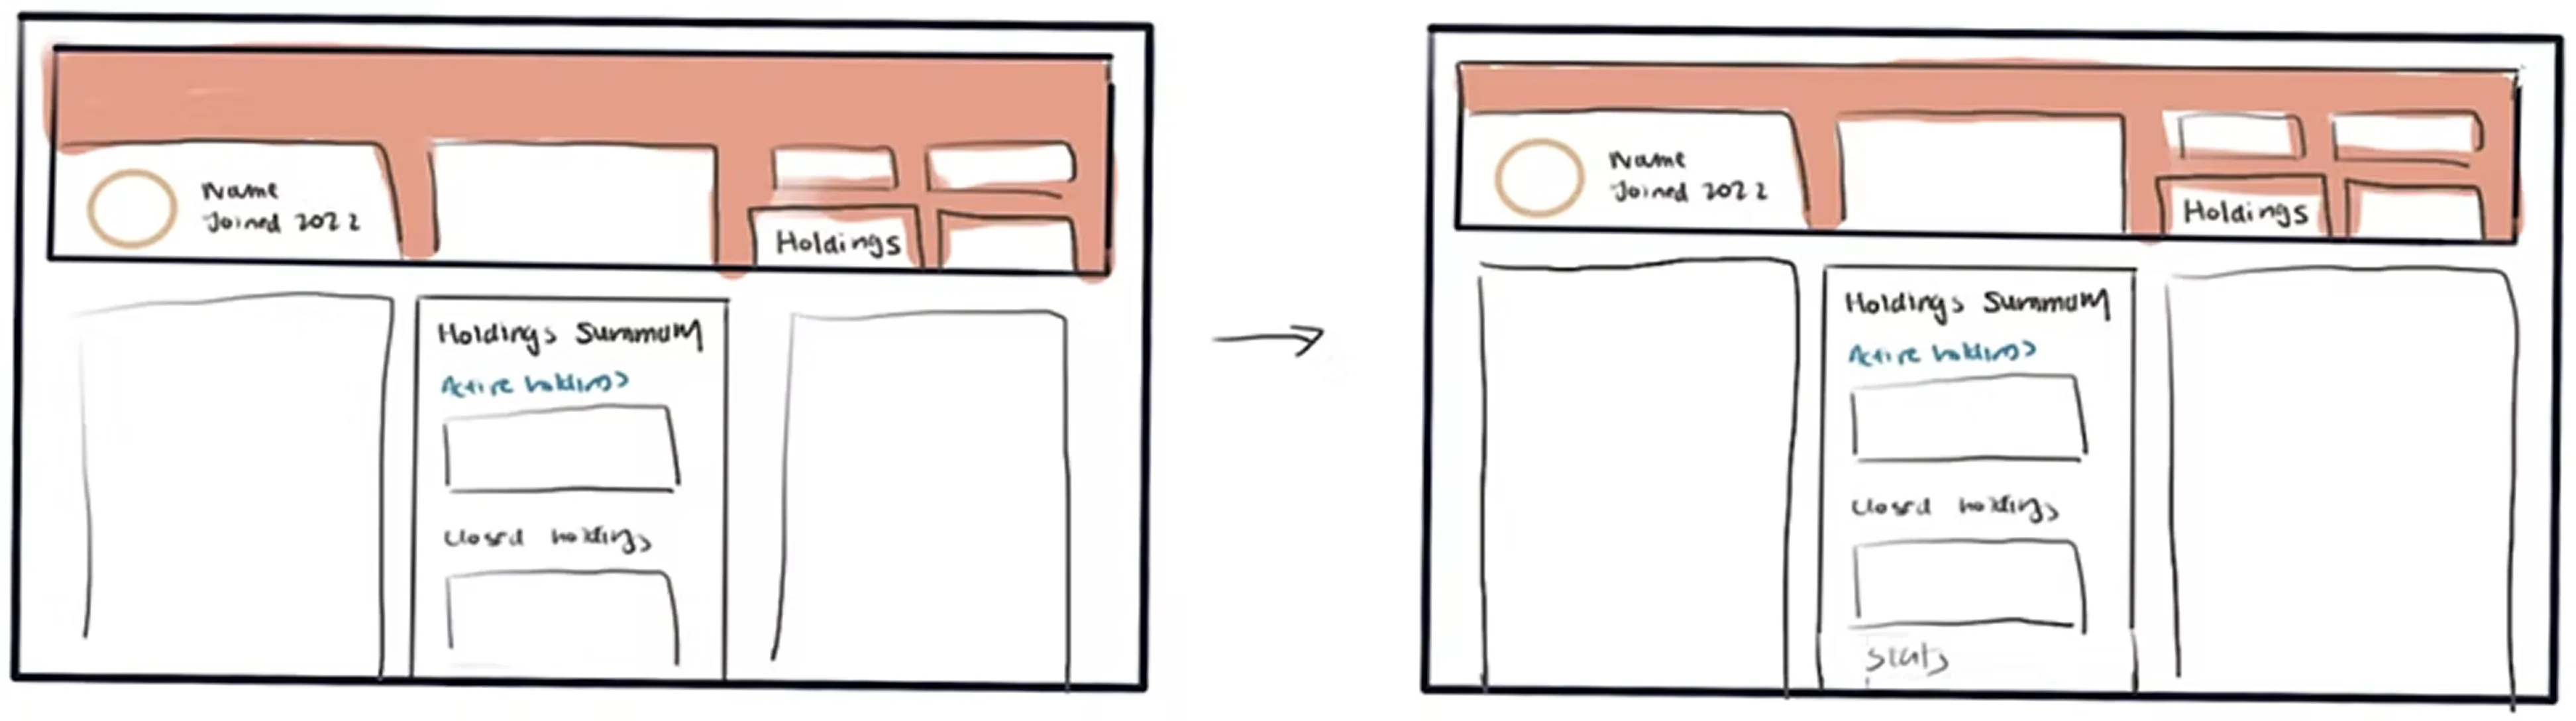
The portfolio page gave too much early space to identity and banner visuals, while key performance data appeared lower in the experience.
Identity should support the portfolio experience, not compete with it.
- Signal
- Important portfolio information depended too much on scrolling.
- Interpretation
- The page behaved more like a profile than a portfolio dashboard.
- Recommendation
- Reduce the banner height and bring performance data higher.
-
Key finding #3
Outcome-led CTAs created stronger intent
Users interacted more with CTAs that connected writing an idea to earning money.
The strongest CTA connected action to outcome.
- Signal
- Users responded to CTAs with stronger value framing.
- Interpretation
- The CTA was not only visible but it made the reward feel immediate.
- Recommendation
- Make actions more outcome-led across the portfolio page.
Examples
Create an ideaStart earning from your insightsBuild your investing track record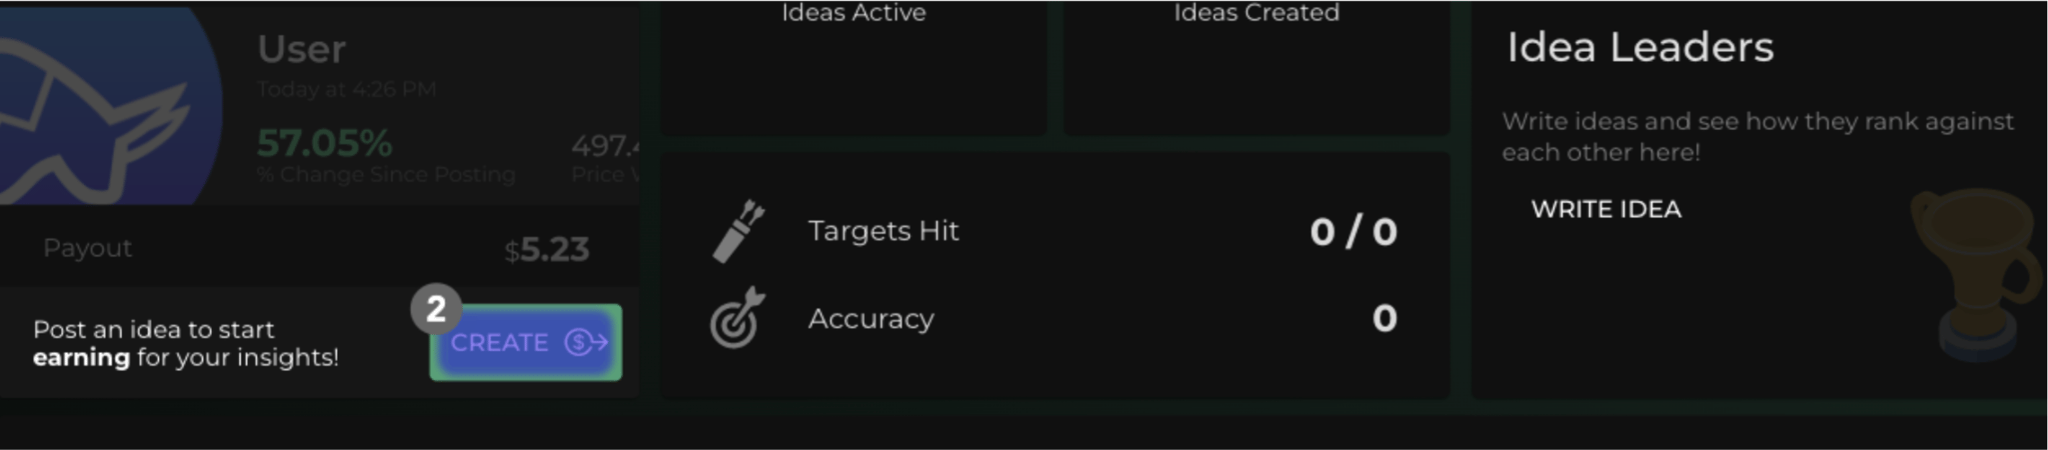
-
Key finding #4
Users looked for orientation before evaluation
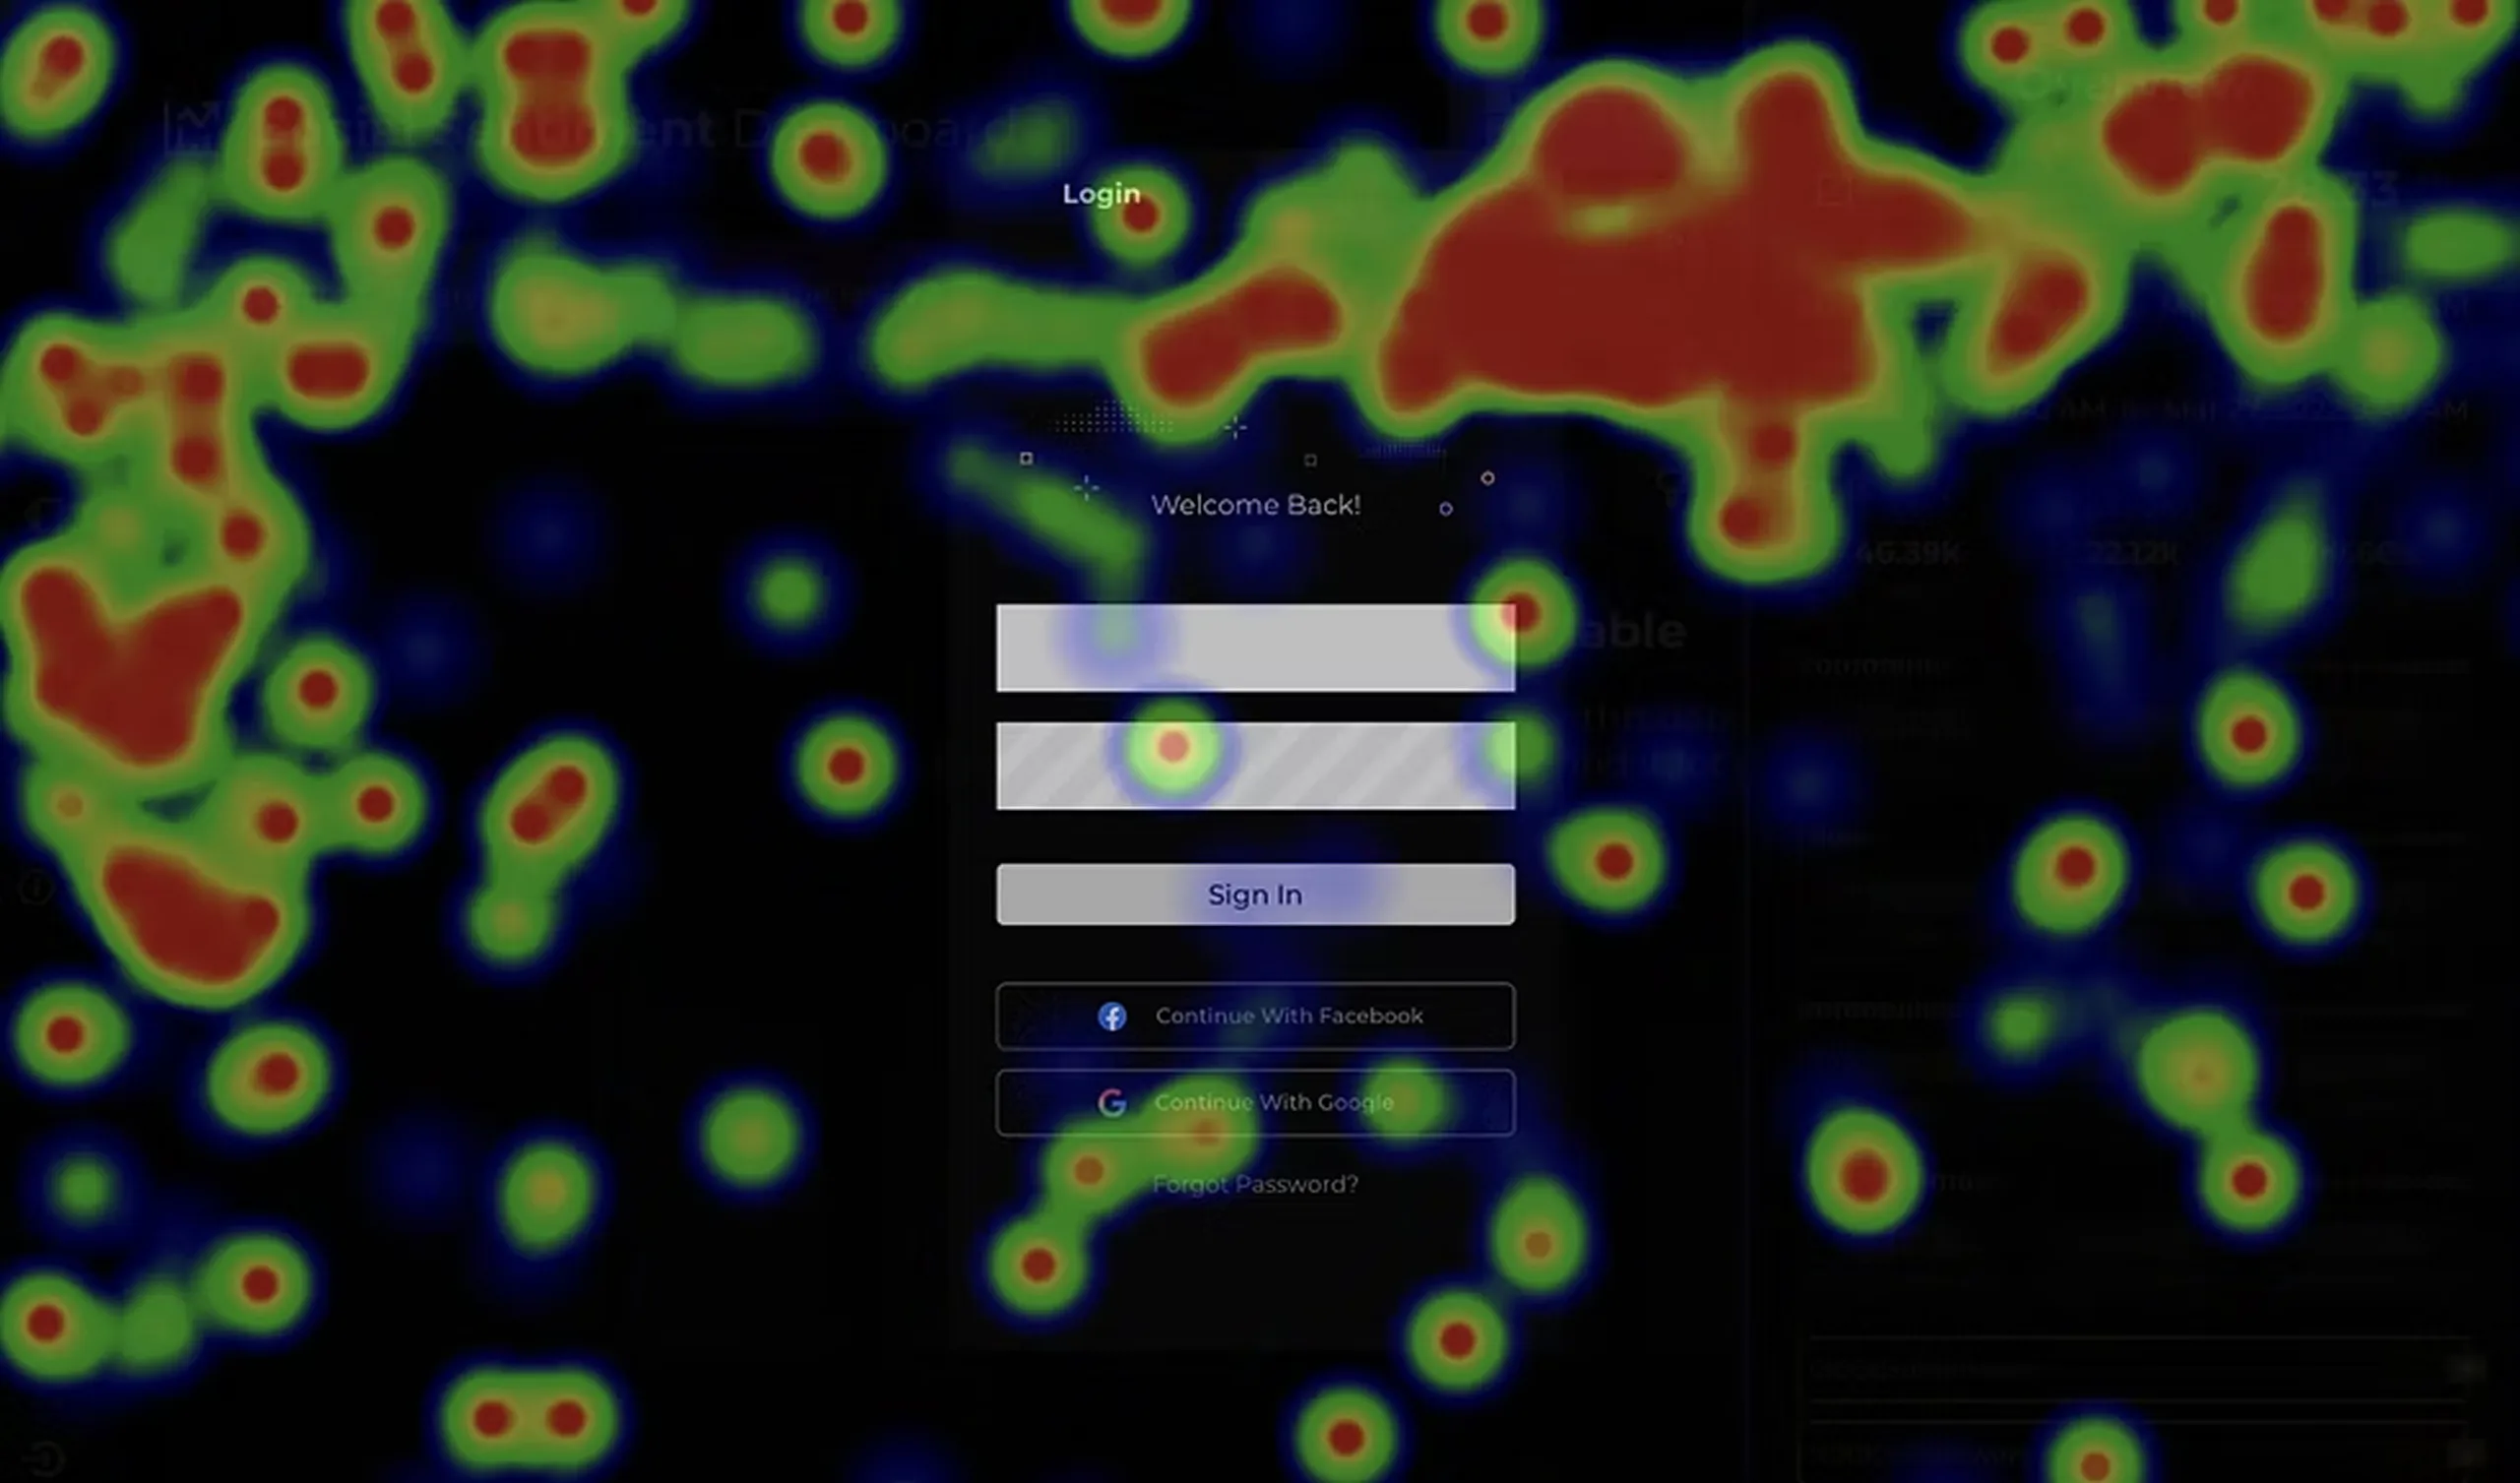
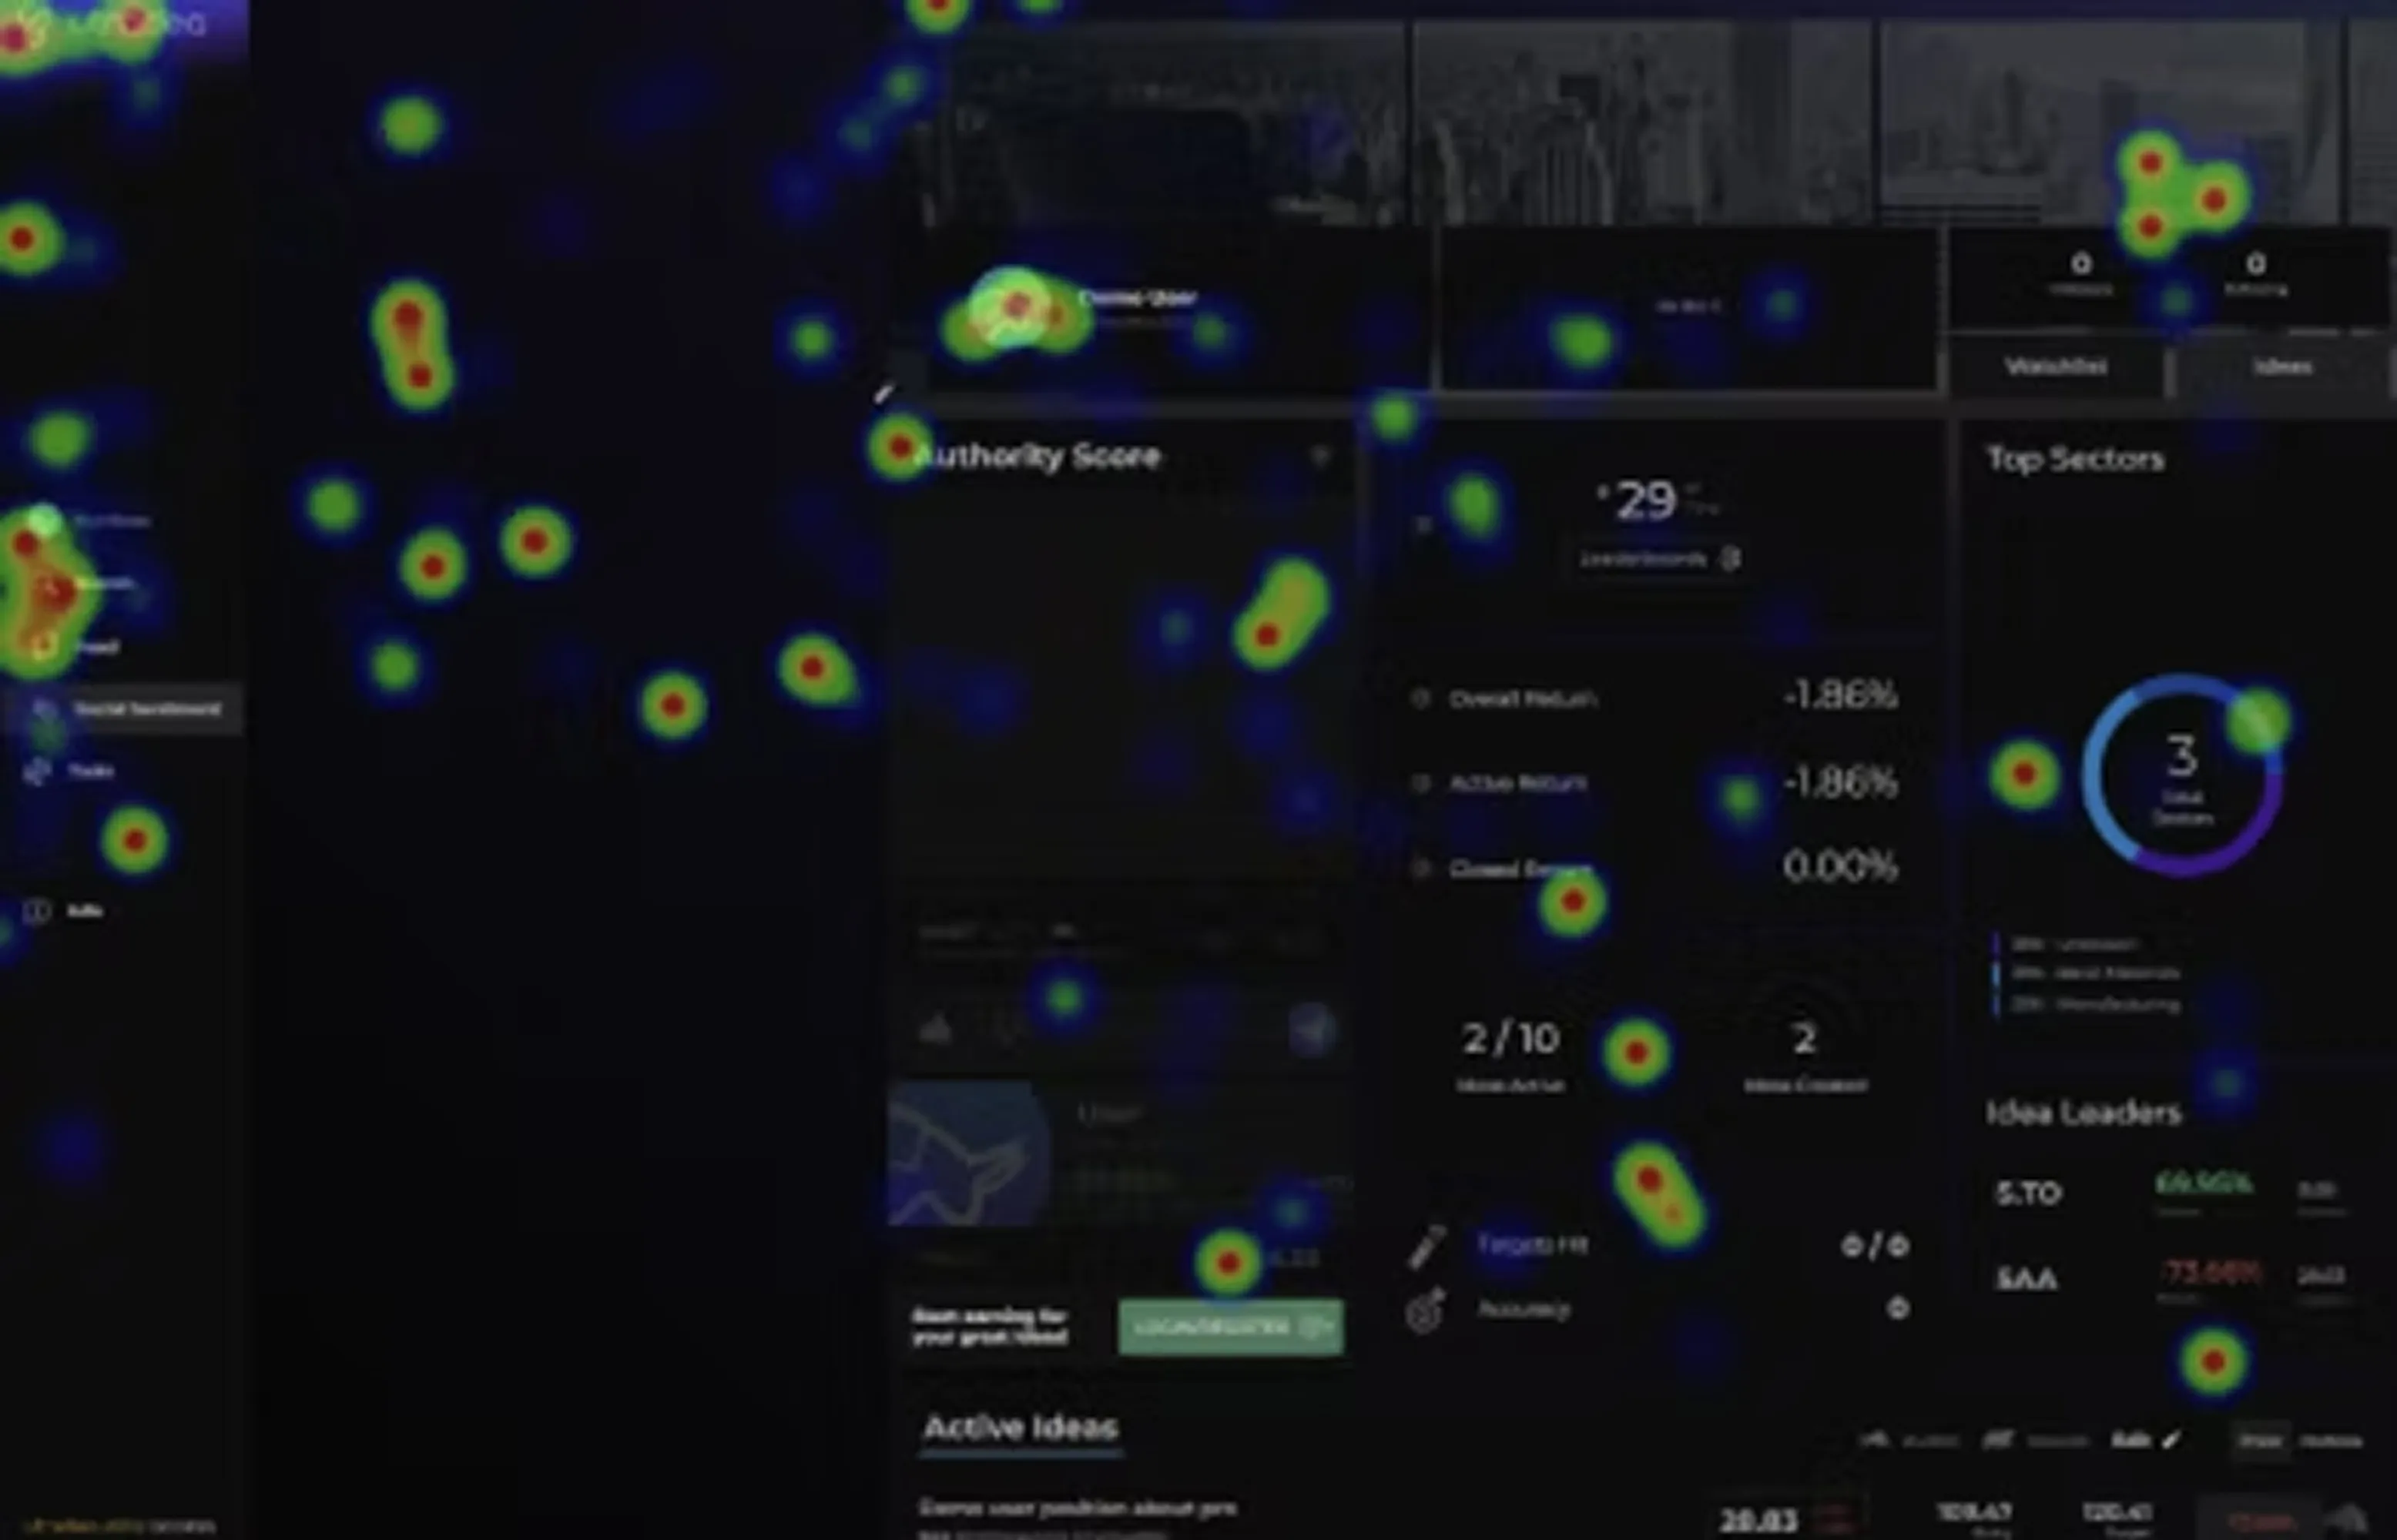
Guest users who spent less than one minute on the portfolio page hovered around the demo username, empty bio, authority score, and navigation before moving away.
This was not only a conversion issue. It was an orientation issue.
- Signal
- Users scanned identity and navigation before engaging with portfolio content.
- Interpretation
- They were trying to understand where they were, what the page represented, and what action was available.
- Recommendation
- Bring login, registration, or create-portfolio actions closer to the profile and portfolio summary area.
-
Key finding #5
Complex data needed a clearer reading order
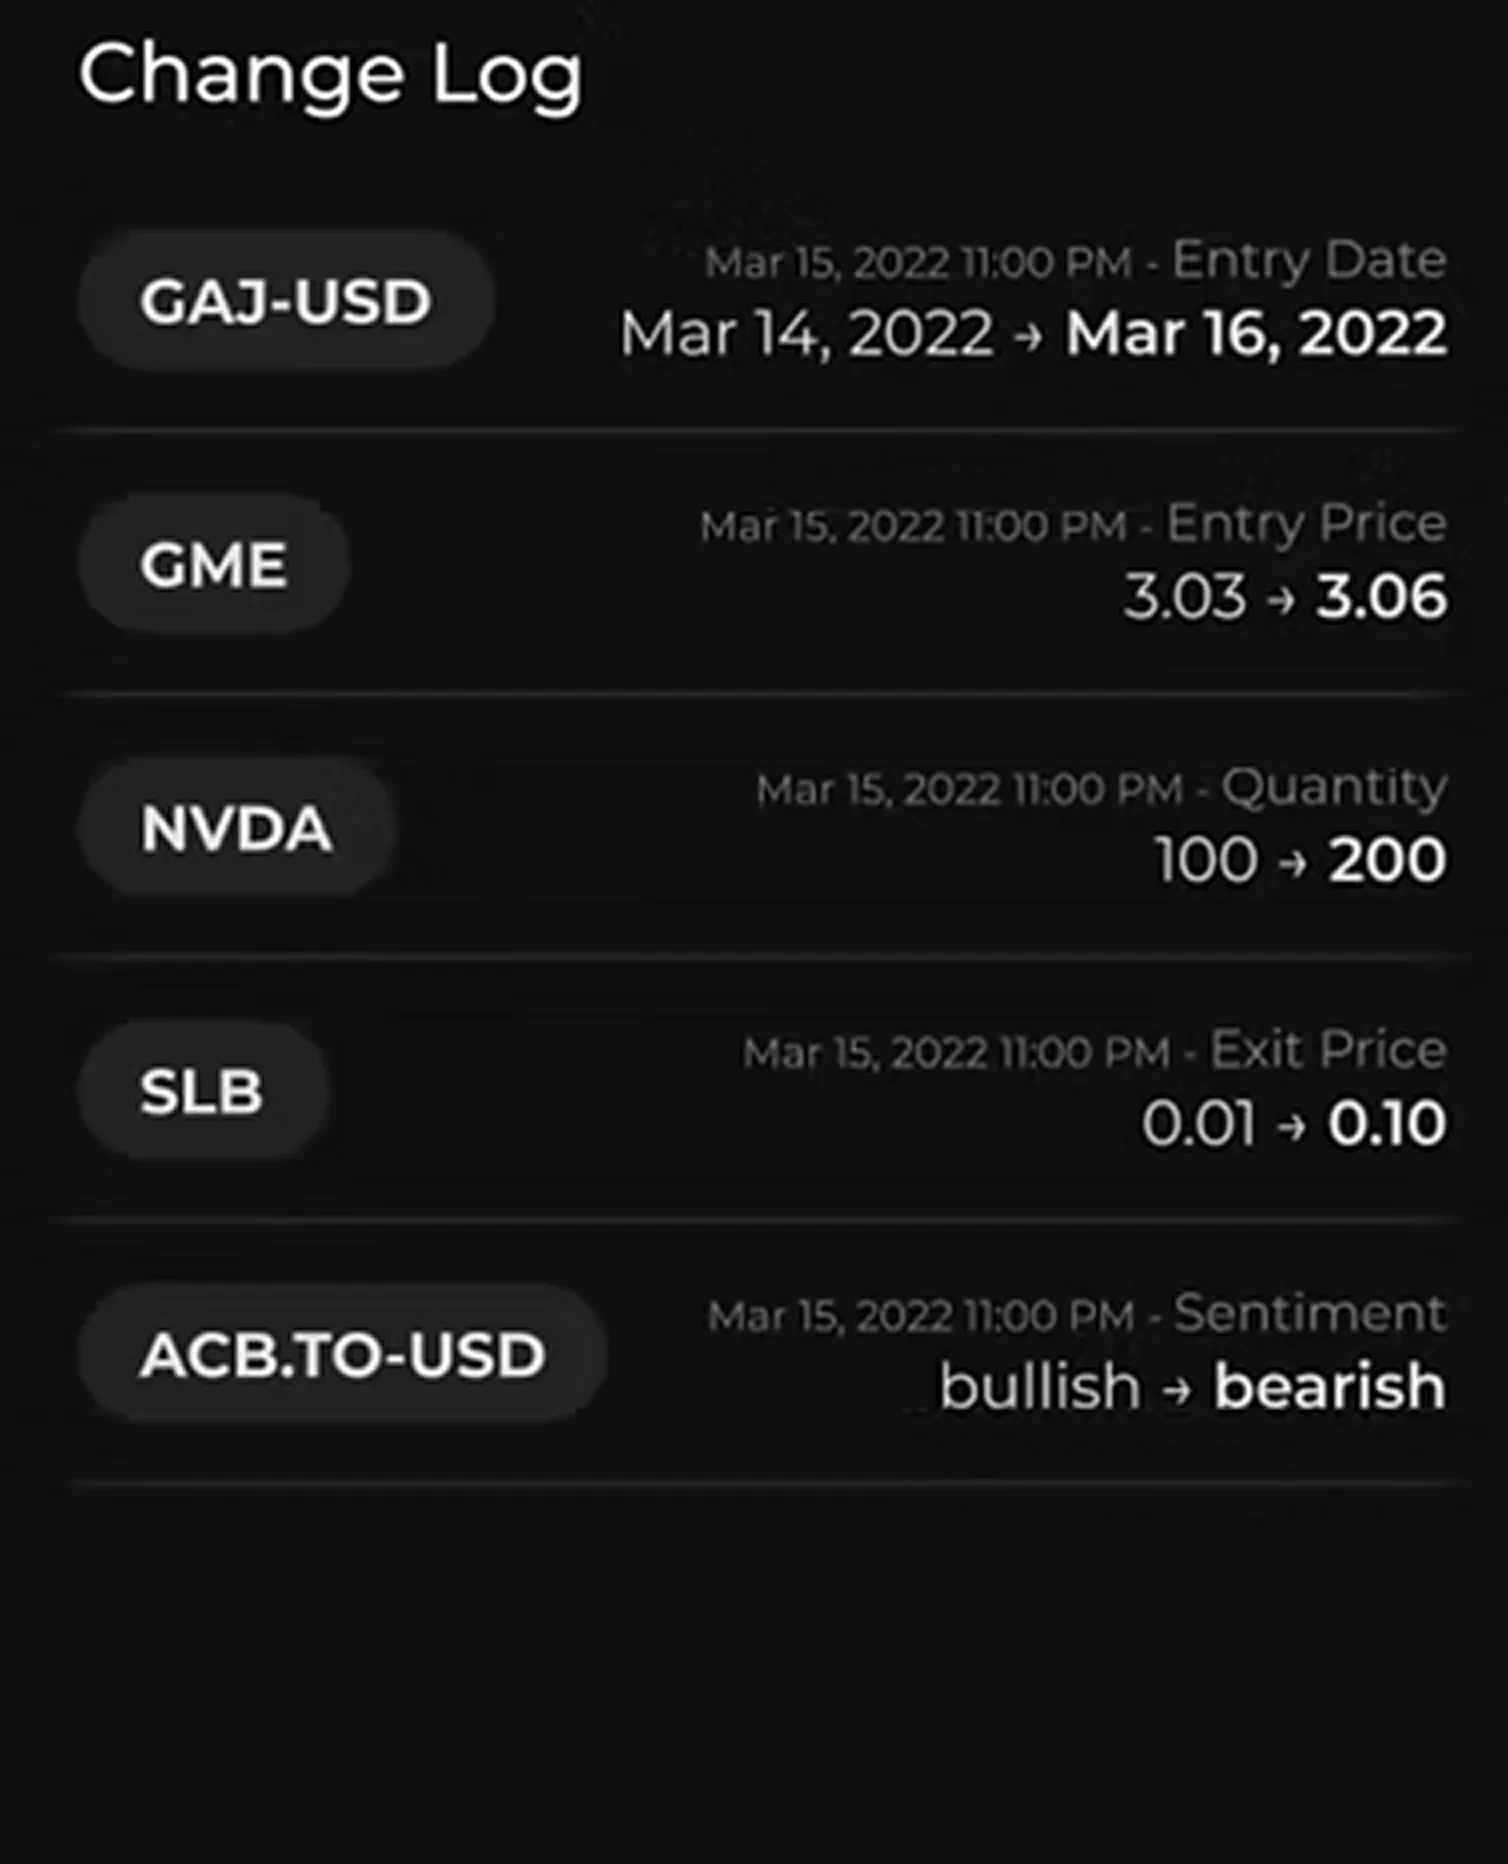
The change log contained useful portfolio updates, but ticker, date, changed field, and value shifts competed visually.
This is not decoration. It is comprehension.
- Signal
- Important details had similar visual weight.
- Interpretation
- Users had to work too hard to understand what changed.
- Recommendation
- Restructure the change log around a clearer sequence: Ticker → Changed field → Old value / new value → Date
Synthesis
The issue was not missing functionality. It was a product hierarchy mismatch.
Across the research, the same pattern repeated: users looked for orientation before evaluation, wanted performance signals before details, and responded more strongly when actions communicated clear value. The portfolio page had useful features, but the experience did not make the next best action obvious enough.
Users were not browsing a profile. They were trying to evaluate performance.
The pattern across sessions
- 01
Look for orientation
Users scan identity, authority, and navigation first to understand where they are.
- 02
Look for performance
They focus on summary metrics, performance signals, and credibility indicator.
- 03
Look for action
Users searched for clear actions that helped them continue, create, or take the next step.
Profile-first
Identity and visual context took priority.
Performance-first
Portfolio status, key actions, and performance signals move higher.
The opportunity was not to add more. It was to move what mattered most higher in the experience.
05 / Impact
A clearer basis for a performance-led product.
Product impact
The research gave the team a clearer basis for improving the portfolio experience. Instead of treating the page as a profile surface, it reframed it as a performance surface; one where hierarchy, action placement, and first-viewport clarity mattered most.
It helped turn broad behavioural patterns into concrete product direction, especially around what should move higher, what should become more actionable, and what should become quieter.
What this informed
- Reprioritizing performance signals in the first viewport.
- Bringing high-value actions closer to where users were already looking.
- Reducing the dominance of profile identity and decorative context.
- Creating a clearer scan path from orientation → evaluation → action.
User impact
The recommended direction aimed to make the portfolio page easier to read, faster to evaluate, and more actionable at a glance. Users should not need to work through profile-heavy content before understanding portfolio status or deciding what to do next.
By aligning the layout with observed behaviour, the experience becomes more supportive of quick judgement and more confident action.
Expected experience outcomes
- Performance status becomes visible earlier.
- Key actions are easier to find and understand.
- Important content is surfaced with less scrolling and less hesitation.
- The page reads as a clearer, more guided experience.
Learning
Analytics are evidence, not answers.
This project taught me to be careful with behavioural data. A hover does not automatically mean confusion. A click does not automatically mean intent. A short session does not automatically mean failure.
The value came from looking for repeated patterns across sessions and connecting those patterns back to product structure.
The biggest lesson was that a strong portfolio experience is not about showing more data, it is about showing the right data first.
Next project
05 / 08UI design · 2026